
Essentia’s latest Behavioral Alpha Benchmark suggests that payoff discipline — and what managers do on the way out — matters more than being right most of the time.
By Clare Flynn Levy

Clare Flynn Levy is CEO & Founder of Essentia Analytics. Prior to setting up Essentia, she spent ten years as a fund manager, in both active equity (running over $1B of pension funds for Deutsche Asset Management), and hedge (as founder and CIO of Avocet Capital Management, a specialist tech fund manager).
Here is a statistic that sounds worse than it is: 94% of the active equity portfolios in our latest Behavioral Alpha Benchmark analysis picked more underperforming stocks than outperforming ones.
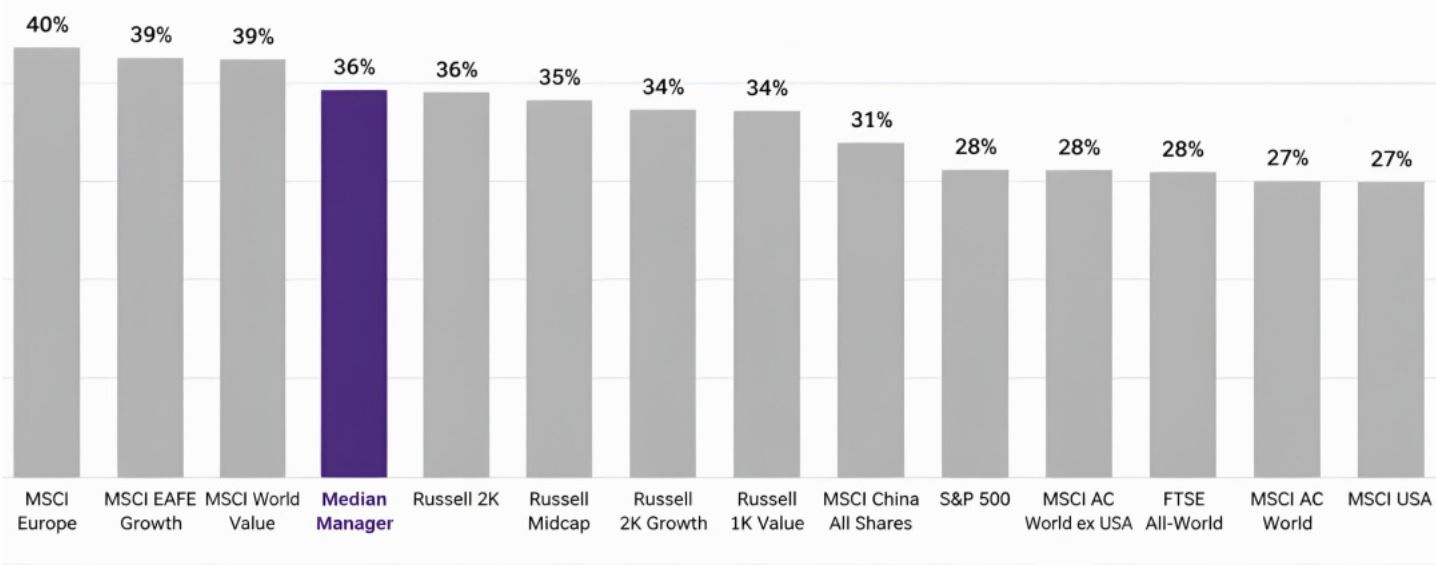
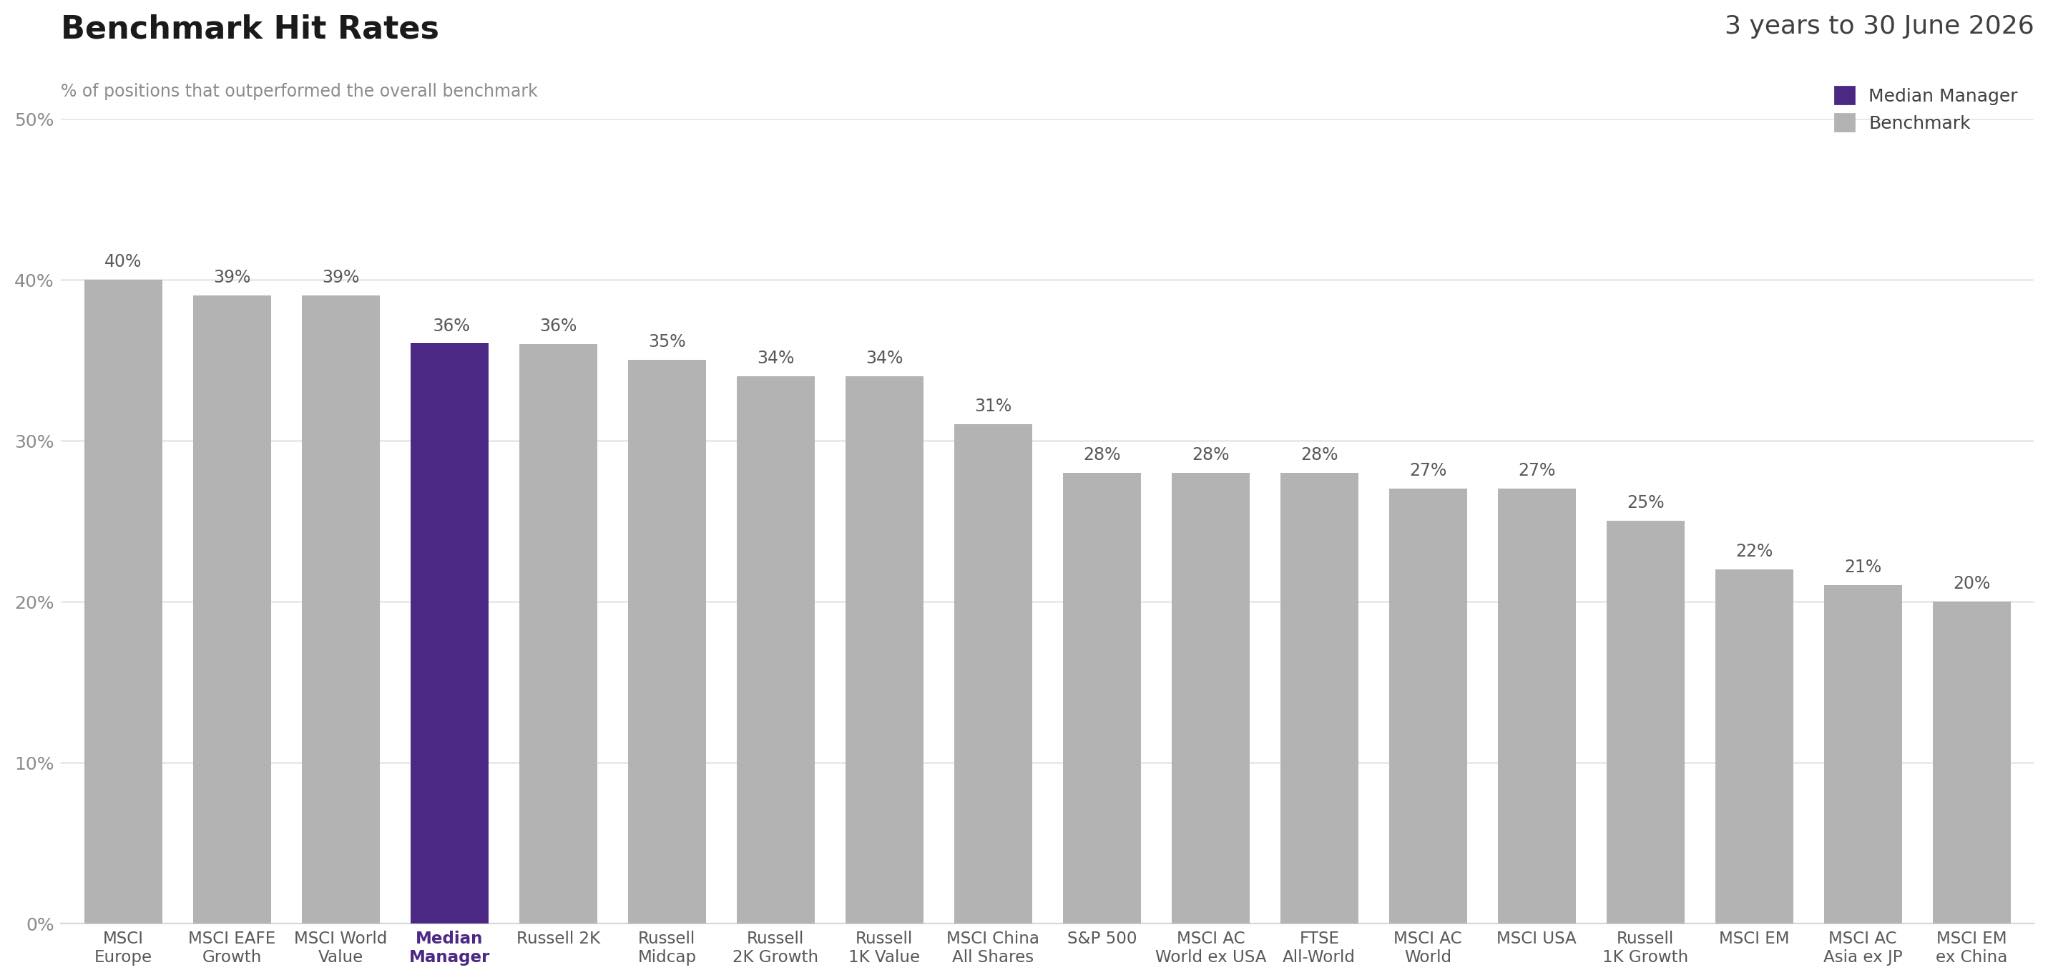
And another: the median stock-picking hit rate, relative to benchmarks, was just 36%.
Yet four in ten of the portfolios with a hit rate below 50% still added value through stock selection. For the median portfolio, winning picks added 1.6x as much value as losing ones destroyed.
That distinction matters. Portfolio managers do not need to be right most of the time to add value — which is just as well in an environment where benchmarks are so concentrated. They need the gains from good decisions to outweigh the damage from bad ones – better payoff ratios, in other words.
The latest Essentia Behavioral Alpha Benchmark ranking provides fresh evidence that investment skill cannot be understood through hit rate — or past performance — alone.
Decision quality rebounded in Q2
The latest ranking covers the three years to 30 June 2026 and includes 199 active equity portfolios, our largest ranking universe to date. In each case, we measure value added relative to the fund’s stated benchmark.
After a weak first quarter, the median Behavioral Alpha Score rose from 48.1 to 49.0. The proportion of ranked portfolios adding value through their overall decision-making increased from 37.0% to 41.7%.
That is a rebound, not yet a turning point. The median score remains below 50, the threshold for value-additive decision making.
An accompanying like-for-like analysis of the 187 portfolios present in both the Q1 and Q2 datasets shows that six of the seven measured decision categories improved. Entry timing was the only category to decline.
| Decision type | % adding value Q1 2026 |
% adding value Q2 2026 |
Change |
|---|---|---|---|
| Overall | 36.9% | 42.2% | +5.3 pts |
| Sizing | 67.4% | 77.0% | +9.6 pts |
| Stock Picking | 38.0% | 43.3% | +5.3 pts |
| Exit Timing | 57.8% | 62.0% | +4.3 pts |
| Size Adjusting | 61.5% | 64.7% | +3.2 pts |
| Scaling Out | 16.0% | 17.1% | +1.1 pts |
| Scaling In | 38.5% | 39.0% | +0.5 pts |
| Entry Timing | 52.9% | 49.7% | -3.2 pts |
The improvement came primarily from better payoffs, rather than managers becoming right more often. The proportion of ranked portfolios with payoff ratios above 100% rose from 50.0% to 54.3%, even as the proportion with hit rates above 50% edged down from 18.8% to 18.1%.
Why a low hit rate is not necessarily a problem
Hit rate — aka “batting average” — is intuitively appealing as a measure of investor skill, but it is increasingly less useful in an environment where benchmark indexes are highly concentrated. Indeed, the percentage of constituent stocks that outperformed the index over the last three years was low for most indices. In most cases, the median fund manager in our study did better.
The lower the hit rate, the higher the payoff ratio a manager needs in order to outperform. The break-even payoff is calculated as follows:
Break-even payoff ratio = (1 − hit rate) ÷ hit rate
A manager with a 36% hit rate, for example, needs gains from successful decisions to be approximately 1.78 times the losses from unsuccessful ones. Clear that threshold, and the manager can add value despite being wrong nearly two-thirds of the time.
In the wider Q2 analytical dataset of 207 portfolios, we found:
- 194 portfolios — 93.7% of the sample — had stock-picking hit rates below 50%.
- Of those portfolios, 42.3% still added value through stock selection.
- The median stock-picking payoff ratio was 1.60.
- Every one of the 13 portfolios with a hit rate of at least 50% added value.
A high hit rate is clearly helpful. But a sub-50% hit rate is normal among professional stock pickers, not automatically a red flag.
For managers and allocators, the more useful question is whether the payoff ratio is high enough for the observed hit rate.
Managers may not be bad at selling — just at scaling out
The conventional view that fund managers are “bad at selling” is too broad.
Across the eleven quarters covered by the Behavioral Alpha Benchmark database, exit timing has consistently been a net positive for the median manager, if we look solely at what happens to the share price post-exit. In the latest analysis, approximately six in ten portfolios added value through the timing of their final exits.
The problem is the length of time it takes them to get to that final exit. Scaling out — essentially, the process of getting out — has been the weakest decision category in every quarter examined. In Q2 2026, 81.2% of the 207 portfolios in the wider analysis destroyed value while scaling out.
Even strong stock pickers were not immune. Of the 95 portfolios that added value through stock selection, 71.6% still lost value while scaling out.
The relationship between stock-picking ability and scaling-out skill was weak: the Pearson correlation between their respective Behavioral Alpha Scores was just +0.18. Good analysis, in other words, does not automatically produce good exit execution.
Scaling out is effectively assessed through comparisons with systematic alternatives, such as an immediate exit or a rules-based unwind. That makes it possible to identify whether gradual selling is genuinely improving outcomes — or merely making the decision to sell feel more comfortable.
Different styles, different decision outcomes
The longer-term data also suggests that decision quality and style performance should not be treated as the same thing.
Value portfolios (which are, in the Behavioral Alpha Benchmark, all measured against value benchmarks) have recorded a higher proportion of value-additive decision-making than both blend and growth portfolios in each of the eleven quarters examined. In Q2, 70.6% of the 34 value portfolios in the wider dataset added value through their overall decisions, compared with 39.1% of blend portfolios and 38.2% of growth portfolios.
Good analysis does not automatically produce good exit execution.
Growth, however, is closing the gap. Its Q2 result was its strongest of the eleven-quarter series, up from a low of 15.7% in Q3 2024.
These comparisons come with the caveat that the style groups are not equal in size and their composition changes over time. They nevertheless reinforce an important point: a style’s market performance and the decision quality demonstrated by managers operating within that style are separate questions.
What fund managers and allocators should take from the results
Three conclusions stand out from the latest data.
- Being wrong more often than right is not unusual — and does not preclude value creation. Hit rate only becomes meaningful when considered alongside payoff.
- The Q2 recovery was broad, but should be interpreted as a rebound from a weak quarter rather than evidence of a sustained change in direction.
- Managers’ exit issues appear more specific — and potentially more fixable — than the conventional wisdom suggests. Managers have generally demonstrated reasonable exit timing, while persistently losing value through the way they scale out.
For portfolio managers, these findings suggest that improving results may not require finding more winning stocks. The greater opportunity could lie in increasing the payoff from good ideas and imposing more discipline on how positions are reduced.
For fund selectors, the findings highlight why past returns alone provide an incomplete picture. Returns show what happened. Decision attribution can offer additional evidence about how those results were produced — and whether the underlying process appears repeatable.
It’s unrealistic to assume that portfolio managers aren’t going to make mistakes — they make far too many decisions with far too much uncertainty to get every call right. But our data shows real value in ensuring that good decisions matter more than bad ones — and that avoidable execution habits do not give the value back.
Explore the latest rankings and portfolio results in the Behavioral Alpha Benchmark app. Insight Pro users can also examine the individual decision categories underlying each portfolio’s Behavioral Alpha Score.
