
Traditional performance attribution models explain what happened. Decision-based attribution explains why — and to what extent it’s down to the decision-making skill of the manager.
By Clare Flynn Levy

Clare Flynn Levy is CEO & Founder of Essentia Analytics. Prior to setting up Essentia, she spent ten years as a fund manager, in both active equity (running over $1B of pension funds for Deutsche Asset Management), and hedge (as founder and CIO of Avocet Capital Management, a specialist tech fund manager).
In Brief
Most institutional investors evaluate active equity managers using Brinson-Fachler attribution or Fama-French factor models — frameworks that explain performance after the fact but say little about the decisions that produced it. Essentia Analytics’ Behavioral Alpha® approach takes a different starting point: it begins with the manager’s actual investment decisions, classifies them by type, and measures the skill demonstrated in each. Research shows that managers with Behavioral Alpha Scores above 50 over a rolling three-year period are 1.5x as likely to outperform in the subsequent year — making decision-based attribution not just a diagnostic tool, but a forward-looking one.
Contents
- Brinson-Fachler Performance Attribution: Allocation vs. Selection
- Fama-French Factor Analysis: Explaining Returns Through Risk Factors
- Decision-Based Attribution: Essentia’s Behavioral Alpha® Framework
- How the Three Frameworks Compare
- Which Performance Attribution Approach Should You Use?
- Frequently Asked Questions
Fama-French Factor Analysis: Explaining Returns Through Risk Factors
What it is: The Fama-French model is a factor-based performance analysis framework. Originally a three-factor model, it extends the traditional Capital Asset Pricing Model (CAPM) by adding company size and value as systematic risk factors alongside the market factor. The later five-factor version includes profitability, investment, and momentum. The idea is that certain types of stocks — small-cap stocks, “value” stocks with high book-to-market ratios — have historically earned higher returns than the market average, so a portfolio’s returns can be explained by its exposure to these factors.
This model provides a more nuanced benchmark for performance: it accounts for the typical outperformance of small-cap and value stocks, and makes it possible to evaluate whether a manager truly added value beyond riding known return factors.
How it’s applied: The analysis involves a regression of the portfolio’s returns against the Fama-French factors: (1) overall market excess return, (2) the size factor (SMB — “Small minus Big”), and (3) the value factor (HML — “High minus Low”). The regression reveals:
- Factor Contributions: If a portfolio tilts toward small-cap stocks, it will have a positive exposure to the SMB factor. If small caps outperform in that period, the model attributes part of the portfolio’s return to that exposure. Studies have shown the three factors can explain up to ~95% of the variation in diversified stock portfolio returns.
- Alpha (Intercept): After accounting for factor contributions, the leftover return is the alpha — the part not explained by known factors. A positive, statistically significant alpha suggests the manager has delivered returns above what their risk profile would predict, and that they have therefore exercised genuine skill.
A practical example: An equity fund outperformed Treasury bills by +6% annually. Fama-French analysis finds that, given the fund’s factor loadings (roughly 1.0 on market, 0.5 on SMB, 0.2 on HML), the expected return from those exposures alone is +5%. The actual return was 6%, so the alpha is +1% — attributed to manager skill.
Why it’s useful: Institutional investors — particularly those embracing a Total Portfolio Approach — use factor models to construct portfolios specifically around alpha and beta. Beta they source from cheap index funds; alpha is what they are looking for from active managers. Factor analysis, like Brinson-Fachler, is used by allocators to ask: “Is this manager actually skilled, or were they just in the right place at the right time?”
What critics say: Critics of multi-factor models raise similar concerns to those levelled at Brinson-Fachler: factor analysis explains portfolio returns with broad exposures after the fact, offering little insight into an active manager’s intentional decisions. For a fundamental investor, it provides little actionable information beyond “watch your factor exposures.”
Meanwhile, the “smart beta” product category was born of the idea that active managers could be replaced with lower-cost, rules-based factor exposure. In practice, smart beta strategies have not consistently delivered superior net-of-fee returns. Some factors have performed well in certain periods, but others — especially value and low-volatility — have lagged expectations. The proliferation of smart beta products has also led to “factor crowding” and reduced effectiveness in live environments.
Decision-Based Attribution: Essentia’s Behavioral Alpha Framework
What it is: Essentia Analytics’ Behavioral Alpha framework takes a fundamentally different starting point. Rather than beginning with monthly or quarterly performance data and working backward, it starts with daily holdings data, identifies the decisions the manager actually made, and evaluates the value added by each decision type.
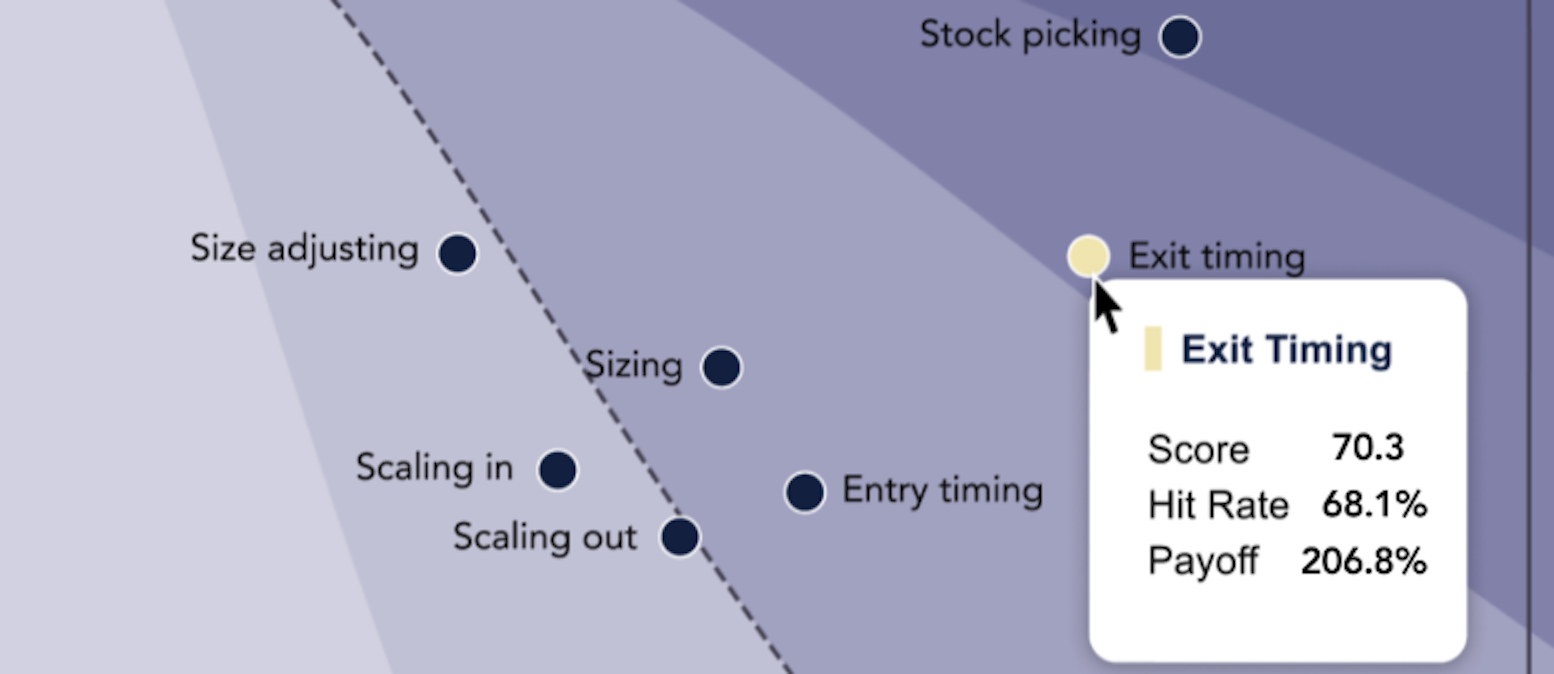
Where traditional models define investor skill in terms of just two broad categories (allocation vs. selection in the case of Brinson, or a generic alpha in the case of Fama-French), Essentia looks at a spectrum of seven key decision types that an equity portfolio manager makes in practice: stock picking, position sizing, entry timing, scaling in, size adjusting, scaling out, and exit timing.
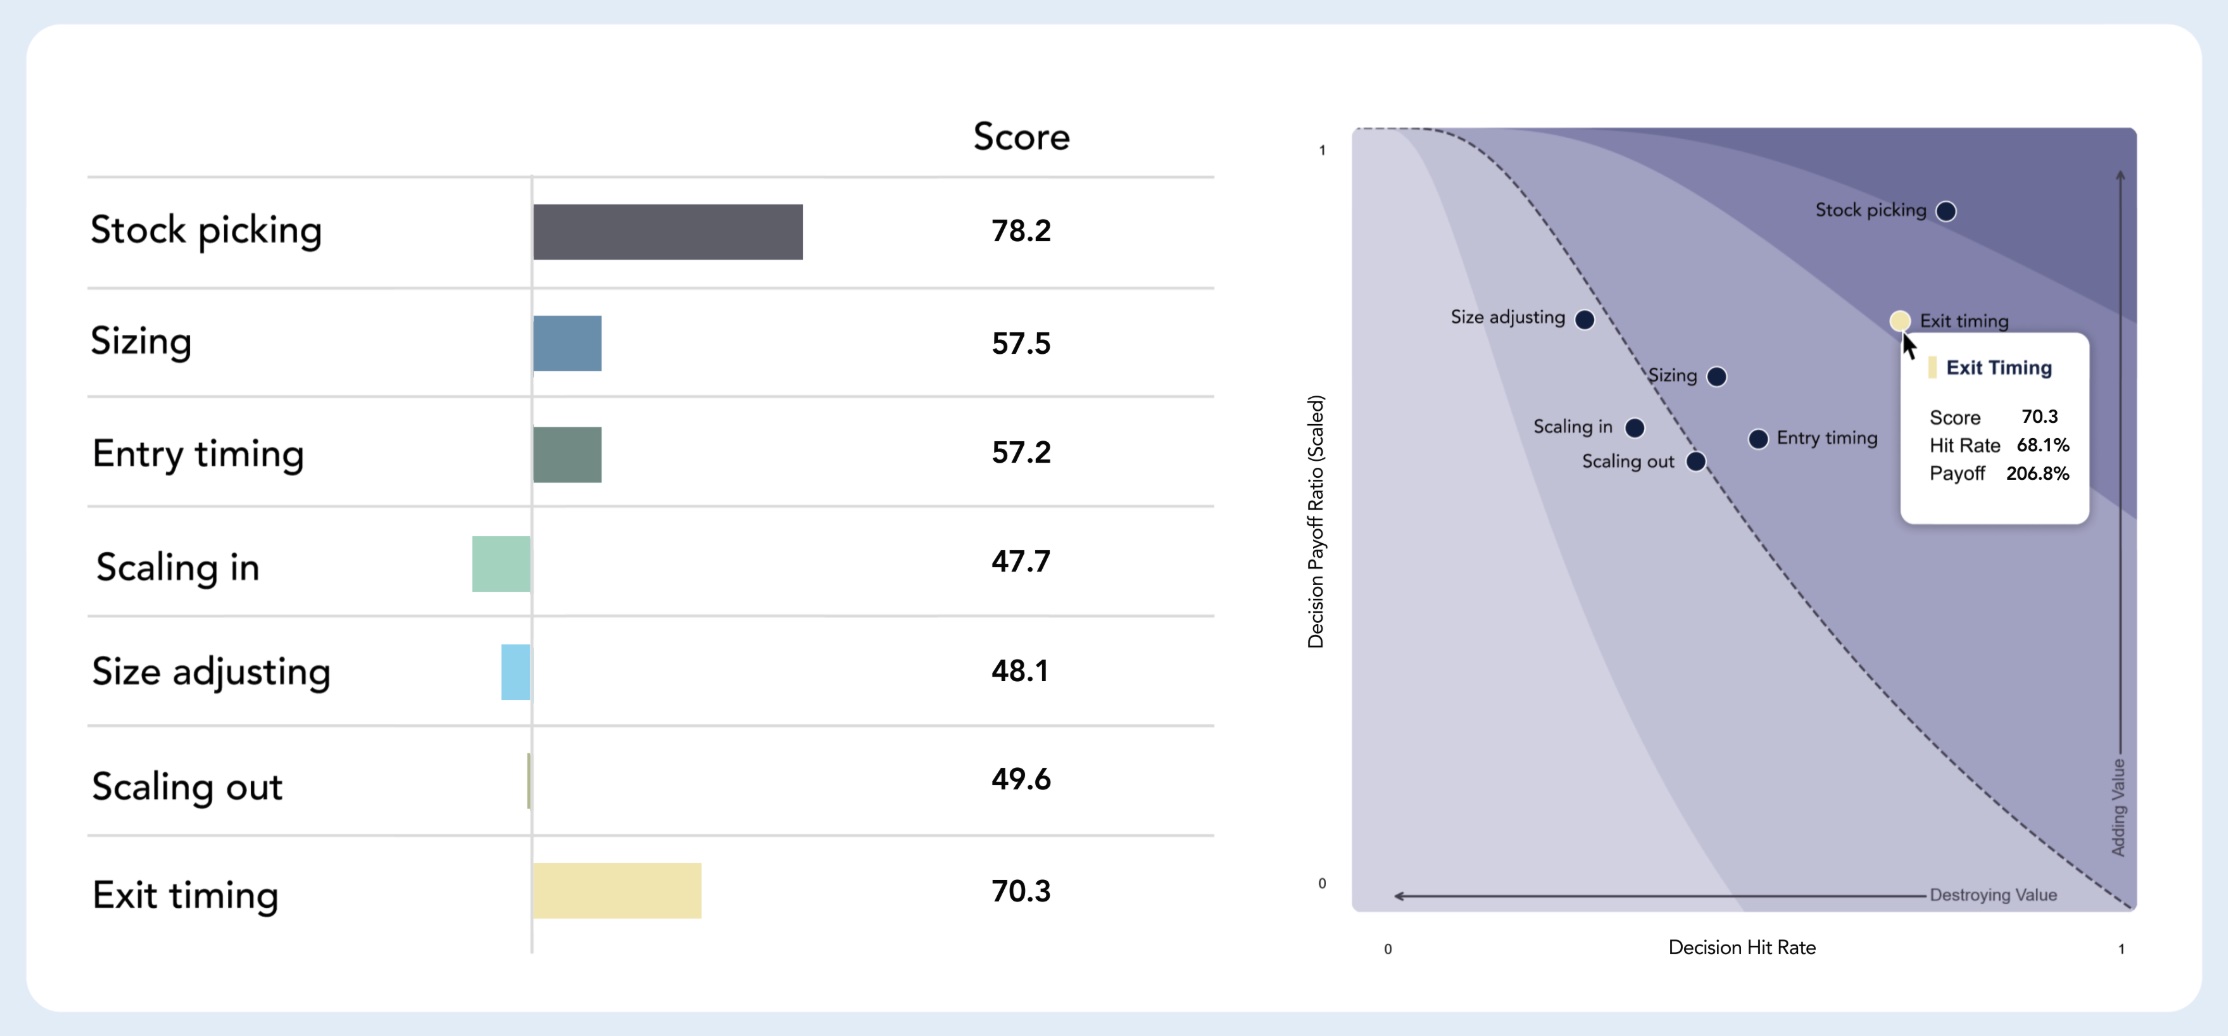
Essentia’s Behavioral Alpha decision analysis shows where a manager is adding value (in this case, decisions around stock picking, timing and sizing) and where there’s room for improvement (scaling in/out and size adjusting strategies). The upper right quadrant of the scatter plot — furthest away from 0,0 — represents the highest value-add.
How it’s applied: The framework starts with historical daily holdings data, identifies decisions made, and classifies them by type. For each decision type, the analysis determines how much value the manager added or lost compared with a reasonable counterfactual representing what would have been achieved by chance. Those value-added scores combine to form a Behavioral Alpha Score ranging from 0 to 100, where 50 represents what would have been achieved by chance.
Why it’s useful: Managers with rolling three-year Behavioral Alpha Scores above 50 have been shown to be 1.5x as likely to outperform in the subsequent year as managers with scores below 50 (Kelleher-Unger, Flynn Levy & Woodcock, 2024). That is very useful information for an allocator. And it makes logical sense: managers who have been making skilled decisions should be expected to continue making skilled decisions.
But perhaps more importantly, decision-based attribution enables a higher quality conversation between allocator and manager than Brinson-Fachler or factor analysis can, because it is based on the manager’s actual decisions rather than a mathematical estimate of them. It does not replace traditional attribution or factor analysis; rather, it offers a different lens — one that resonates strongly with the manager.
A real-life practical example: A fundamental equity manager has underperformed their benchmark over the past three years, leading to mounting pressure from investors. Traditional attribution shows negative relative returns, split between stock selection and asset allocation. However, the manager’s Behavioral Alpha Score is 53 — above the benchmark of 50 — indicating that they have been making skilled decisions on the whole. Drilling into decision types reveals that while stock picking has hurt during the period, the manager’s sizing and size-adjusting decisions have been good. In Behavioral Alpha terms, the fund is a “diamond in the rough.” The investor can take assurance from this objective measure of process integrity, even when performance is temporarily disappointing.
Brinson-Fachler vs. Behavioral Alpha: Where Brinson-Fachler might show that a manager added +1% via stock selection in the tech sector in a given quarter, Essentia’s analysis zooms in on the decisions behind the performance. Behavioral Alpha could reveal that this outcome stemmed from strong stock-picking decisions, partially offset by overly cautious position sizing or mistimed exits. While the numbers don’t sum in a traditional attribution sense, this breakdown provides valuable insight into which aspects of the manager’s process are adding value and which may be holding it back.
Fama-French vs. Behavioral Alpha: The Fama-French model distinguishes between returns from systematic factor exposures and true alpha. In a similar spirit, Behavioral Alpha aims to isolate the manager’s true skill from what could be due to general market movements or style biases. One could say that Essentia breaks the concept of “alpha” into multiple components of skill — telling you where the alpha comes from, rather than treating it as a single residual number.
What stands in the way of wider adoption? Historically, asset managers have not been willing to share data more granular than monthly performance and quarterly holdings with investors. The reporting infrastructure formed around this minimal data set — which is why Brinson-Fachler and factor analysis start with performance and work backward. It has been all that was available.
However, times have changed. Daily holdings data is easily available to and shareable by any institutional-grade asset manager — most already share it with third-party custodians. And thanks to the proliferation of cheaper index funds, active managers’ incentives have shifted dramatically. Today, managers are far more willing to provide whatever data is required by a trusted investor to win or retain a mandate. The allocator need only ask.
How the Three Performance Attribution Frameworks Compare
| Dimension | Brinson-Fachler | Fama-French | Behavioral Alpha |
| Data input | Monthly/quarterly performance vs. benchmark | Monthly/quarterly returns vs. factor indices | Daily holdings data |
| What it measures | Where excess return came from (allocation vs. selection) | How much return is explained by factor exposures vs. alpha | Value added by each of seven decision types |
| Granularity of skill assessment | Two categories (allocation, selection) | One residual (alpha) | Seven decision types (picking, sizing, entry timing, scaling in, size adjusting, scaling out, exit timing) |
| Starting point | Performance outcomes | Performance outcomes | Manager’s actual decisions |
| Forward-looking value | Limited — explains past, doesn’t predict future | Limited — alpha persistence is debated | Strong — BA Score >50 predicts 1.5x higher probability of subsequent outperformance |
| Primary limitation | Doesn’t connect to specific manager decisions | Treats alpha as a single unexplained residual | Requires daily holdings data |
| Best used by | Allocators reviewing performance vs. benchmark | Allocators distinguishing factor exposure from skill | Allocators and managers seeking to understand and improve the investment process |
Which Performance Attribution Approach Should You Use?
Each of these three frameworks offers a distinct lens through which to evaluate manager performance:
Brinson-Fachler explains outperformance by breaking it down into allocation and stock selection effects. It is useful for explaining where performance came from relative to a benchmark, but it doesn’t connect directly to specific investment decisions or behaviour by the manager.
Fama-French decomposes return into systematic factor exposures and isolates alpha as what remains. It is widely used to distinguish skill-based returns from passive factor tilts, but it lacks granularity about what the manager actually did to generate that alpha.
Essentia’s Behavioral Alpha starts with the manager’s actions — their individual investment decisions — and quantifies how much value those decisions added or detracted, compared to a benchmark of randomness. This process-based view allows both managers and allocators to see not just what happened, but why — and whether it is likely to persist.
Used together, these models provide a fuller picture: Brinson-Fachler and Fama-French provide a quantitative explanation for performance outcomes, while Behavioral Alpha connects performance to the decisions the manager actually made. That is intuitive to everyone involved: good decisions lead to good outcomes.
Frequently Asked Questions
What is performance attribution?
Performance attribution is the process of explaining why a portfolio’s return differed from its benchmark. Traditional approaches (like Brinson-Fachler) decompose that difference into allocation and selection effects. Newer approaches, such as decision-based attribution, start with the manager’s actual investment decisions and measure the skill demonstrated in each.
What is the difference between Brinson-Fachler attribution and Fama-French factor analysis?
Brinson-Fachler breaks excess return into allocation effects (being in the right sectors) and selection effects (picking the right stocks). Fama-French explains returns through exposure to systematic risk factors — market, size, value — and treats whatever is left over as alpha. Both work backward from performance outcomes; neither connects directly to specific decisions the manager made.
What is decision-based attribution?
Decision-based attribution (also called Behavioral Alpha® analysis) starts with a portfolio manager’s daily holdings data, identifies the investment decisions they made, classifies each by type (stock picking, sizing, timing, scaling, exits), and measures the value added by each. It provides a process-level view of skill that traditional performance attribution cannot.
Can performance attribution predict future fund performance?
Traditional attribution models (Brinson-Fachler, Fama-French) are diagnostic — they explain past performance but have limited predictive value. Essentia’s Behavioral Alpha approach has shown predictive power: managers with rolling three-year Behavioral Alpha Scores above 50 are 1.5x as likely to outperform in the subsequent year (Kelleher-Unger, Flynn Levy & Woodcock, 2024).
What data does decision-based attribution require?
Decision-based attribution requires daily holdings data from the portfolio manager. While this is more granular than the monthly or quarterly data used by Brinson-Fachler and Fama-French, most institutional-grade asset managers already produce daily holdings data for custodians and can share it with allocators on request.
How does Behavioral Alpha relate to smart beta?
Smart beta strategies attempt to deliver factor-based returns (size, value, quality) at lower cost than traditional active management. Behavioral Alpha measures something different entirely: the skill a manager demonstrates in their actual investment decisions, independent of factor exposures. A manager can have high Behavioral Alpha regardless of their style or factor profile — it is about how they make decisions, not which factors they are exposed to.
References
Kelleher-Unger, I., Flynn Levy, C., & Woodcock, C. (2024). Actions Speak Louder Than (Past) Performance: The Relationship Between Professional Investors’ Decision-Making Skill and Future Fund Returns. Available at SSRN.
Further Reading
- What Is Behavioral Alpha? | Essentia Analytics
- The Behavioral Alpha Benchmark | Essentia Analytics
- Actions Speak Louder Than (Past) Performance | SSRN
- The Benefits of Active Management and the Shortcomings of Brinson | FactSet
- The Future Landscape of Performance Attribution | Confluence
- Factor Investing Insights You Won’t Hear from Fama and French | Alpha Architect
- The Factor Mirage: How Quant Models Go Wrong | CFA Institute
- Fama-French Three Factor Model | Investopedia
- How Smart is Smart Beta? | Wharton
