

Our analysis of real-world data shows a clear correlation between nudge engagement and portfolio performance.
By Chris Woodcock

Chris Woodcock leads the research and product teams for Essentia Analytics. Prior to joining Essentia, Chris was a technology analyst at GAM Investment Management and a hedge fund analyst at GAM Multi Manager in London. Before his career in financial services, Chris was a professional footballer with Newcastle United.
For years, Essentia has worked with clients to establish a data-driven feedback loop: we collect their trade, performance and behavioral data and nudge them with notifications when we see patterns or indicators that they have told us they want to be alerted to. They act (or choose not to act), we process the new data, and the cycle repeats.
Anecdotally, we have seen this approach work very well — clients who have been with Essentia for more than twelve months generate, on average, 150bps of incremental alpha per year above their pre-Essentia performance.
But we’re a research-driven organization, so we sought to dig deeper than this anecdotal analysis. Following on other academic research (including the recent piece on the effects of mindfulness on cognitive bias mitigation co-authored by Essentia’s own Philip Maymin), we queried our database of real-world portfolio manager behavior to answer the question: Does nudge engagement by the investment team lead to alpha generation in the portfolio?
Our study is outlined below. To summarize, while we found that the data doesn’t prove causation given the myriad exogenous factors that affect outcomes, there is a clear correlation between nudge engagement and portfolio performance. This is most strikingly shown by comparing the simple median performance of the managers who engaged with nudges to those who didn’t.

Our analysis of 75 real-world portfolio managers found a 160bps difference in annualized relative performance between managers who engaged with nudges and those who did not.
The Study
To conduct this research, we used our database of 75 portfolios on which we collect in-depth trade and performance data as well as a variety of less-traditional behavioral indicators including trade rationales, sentiment, and responses to nudges across a variety of scenarios (everything from alerts regarding potentially vulnerable positions to notifications that a holding may be at or near the peak in its alpha lifecycle — click here for an overview of Essentia Nudges).
We sent 15,000 nudges to the managers of these 75 portfolios from July 2018 to March 2021. They responded on over 4,000 occasions.
Using this anonymized data, we did two analyses. First, we looked at the correlation between the number of nudge responses per manager and average monthly portfolio performance (relative to a benchmark index for most managers and absolute for those who opt to track performance in absolute terms). We found that those who submitted more nudge responses per month tended to enjoy significantly better performance than those who engaged with fewer nudges.
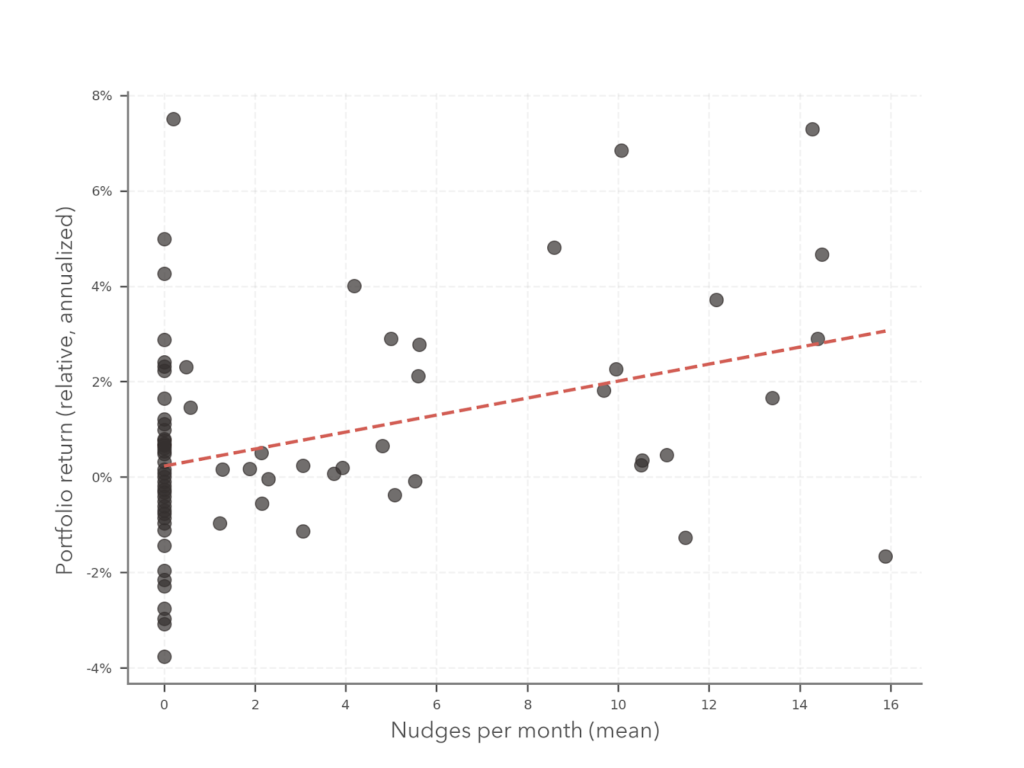
The greater the response rate, the larger the outperformance. Correlation between average responses per month and annualized return was 0.39 (p-value=0.0004). Regression line equation is y = 0.0023 + 0.00178 x nudges per month.
The results, while expected, were dramatic, and we couldn’t help but extrapolate a fun fact from this data: on average, every monthly response correlated to an additional 18bps of alpha per year!
Our second analysis compared those managers who never submitted a single nudge, with those who submitted at least one nudge at some point during the period. Once again, managers who engaged outperformed those who didn’t. We expected this, but the margin between the two — 160bps of relative performance — was surprisingly large.
Managers who engaged in nudges (dark bars) significantly outperformed their benchmark, while managers who did not were essentially flat.
Furthermore, of the managers who never completed a single nudge, average annualized relative performance was just 5bps, compared to those managers who had completed at least one nudge, where average annualized relative performance was 165bps. This is a highly significant difference (p-value=0.0009303).
Our work into this line of inquiry continues – as mentioned above, we see impressive correlation in what we have studied thus far, but not yet causation (which, in fact, may be impossible to demonstrate conclusively given the confounding exogenous variables at play). So while we may never be able to say that completing nudges will, in fact, make you a better performing manager, we can say this: Managers who engage with nudges, on average, significantly outperform their index. Managers who do not engage, on average, do not (in fact, assuming fees of 75bps, 73% of them underperform, net of fees).
As more and more managers work with Essentia, our nudge response data set grows. We’ll continue to analyze it so we can expand and refine this research — so stay tuned for updates.
In the meantime, we’d love to hear your thoughts, and we’re happy to discuss the work we do to make it easy for managers to engage with nudges. Contact us here, and we’ll follow up with you soon.
