

This quarter’s results show a shift in the drivers of decision-making skill — from stock selection toward capital-allocation and timing decisions.
Our latest (three years ended September 30, 2025) Essentia Behavioral Alpha Benchmark ranking shows a modest pullback in median Behavioral Alpha Scores following Q2’s rebound, yet continued strength in execution-driven decision types. The median Behavioral Alpha Score for the 133 portfolio managers in our ranking — which measures the value added through decision-making, when compared with what would have been achieved by chance — was 49.3, down from 50.6 in the prior period.
Decision hit rates remained low, with only 21.8% of portfolio managers adding value through 50% or more of their decisions, roughly flat versus 21.4% in Q2. At the same time, payoff breadth narrowed: 56.4% of portfolios had payoff ratios above 100%, compared with 67.9% last quarter, and the median payoff declined from 116.2% to 107.6%.
As equity-market returns remained concentrated in a handful of large-cap stocks, stock selection continued to challenge even experienced portfolio managers. But improvements in areas such as sizing, size adjusting, and entry timing — each up meaningfully this quarter — helped offset those pressures, showing how decision-making skill is expressed through more than just stock picking.
About the Behavioral Alpha® Benchmark
The Essentia Behavioral Alpha Benchmark (EBAB) is the investment management industry’s only systematic assessment of decision-making skill. Unlike traditional rankings based on past returns, EBAB evaluates how portfolio managers make investment decisions over a 36-month period, isolating skill from luck and market movements.
Using proprietary decision attribution analytics, the ranking assesses managers across seven key decision types. A manager’s Behavioral Alpha Score (BA Score) is calculated based on their hit rate (percentage of decisions that add value) and payoff ratio (the magnitude of good vs. bad decisions).
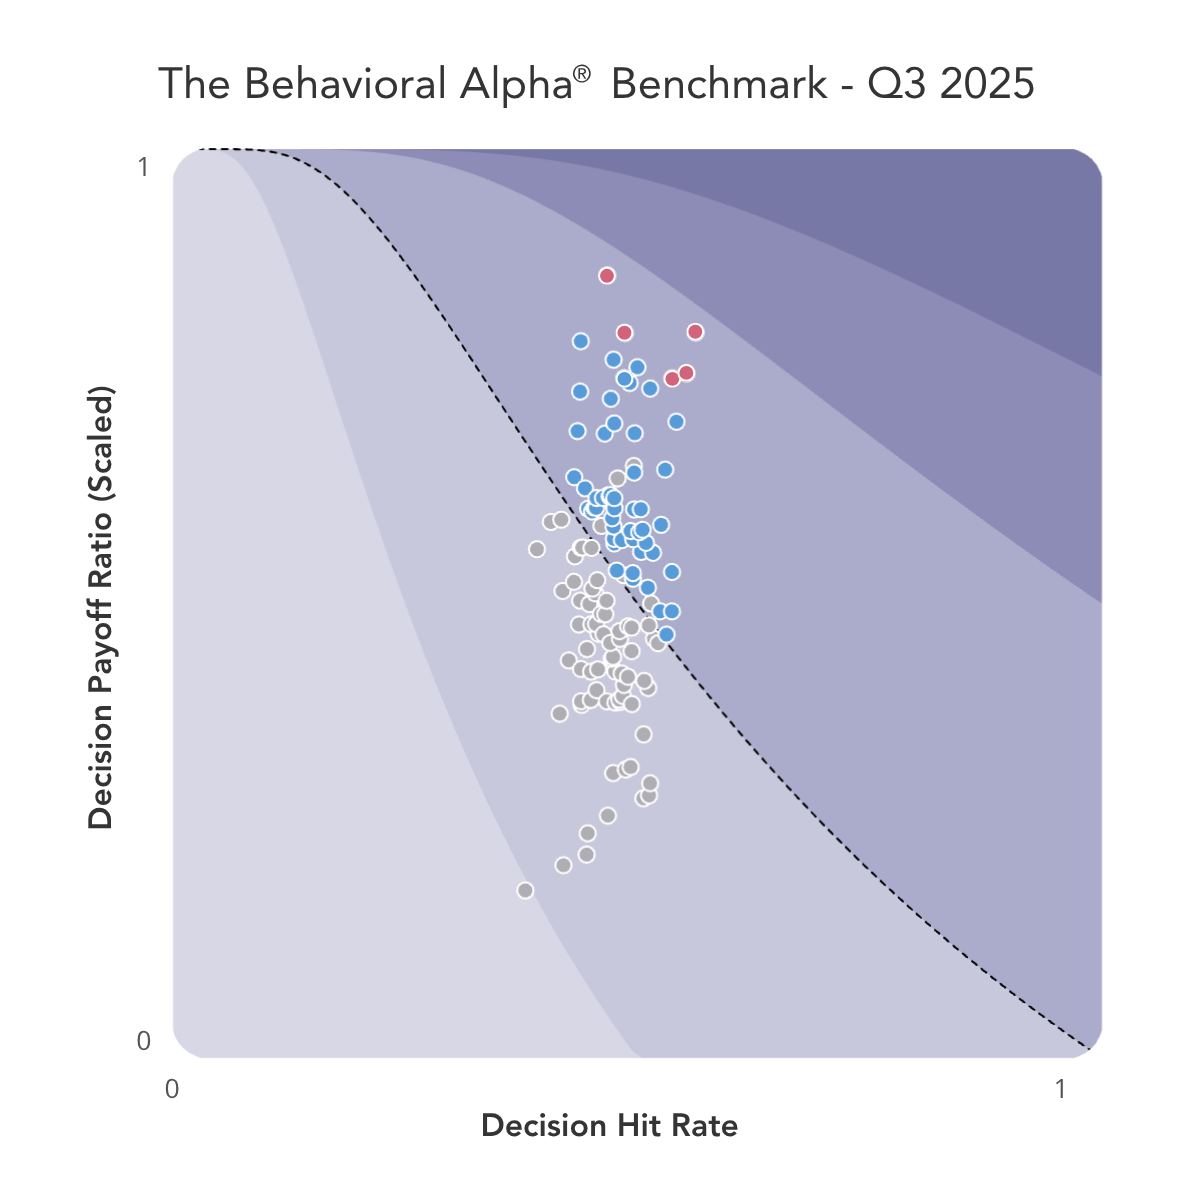
The five highest-scoring managers, represented by the magenta dots, are those towards the upper-right on this frontier diagram — furthest away from 0,0.
A Behavioral Alpha Score above 50 indicates consistent value-additive decision-making. And recent research shows that managers with 3-year BA Scores over 50 are 1.5x as likely to outperform their own benchmarks over the subsequent 12 months as managers with BA Scores less than 50. Managers who have demonstrated good decision-making over the last 3 years have been more likely to go on to outperform.
It is possible for a manager who has been underperforming to have a BA Score over 50, implying that they are ‘undervalued’ by performance-based metrics. Likewise it is possible for a manager who has been outperforming to have a BA Score under 50 – in other words, to have got lucky. That has implications for fund managers and fund selectors alike. Essentia is carrying out further research in this area, so watch this space!
Top 5 Managers for the 3 Years to 30 Sept 2025
The most recent 36-month assessment concluded on September 30, 2025, evaluating the demonstrated decision-making skill of 133 active equity mutual fund and investment-trust portfolio managers using the Behavioral Alpha Score. The Top 5 managers are as follows:
| Rank | Manager(s) | Portfolio (Benchmark) |
| 1 | Janakiraman Rengaraju Rajasa Kakulavarapu Sandeep Manam |
Franklin India Flexi Cap Fund |
| 2 | Sukumar Rajah |
Franklin India Fund |
| 3 | Robert Choi Al Chan Chris Richey Kevin Hill Ron Dornau |
Silvercrest International Small Cap Value Fund |
| 3 | ARGA Team Managed | ARGA Emerging Markets Equity |
| 4 | Rakesh Bordia Caroline Cai Allison Fisch John P. Goetz |
Pzena International Value Fund |
Key Takeaways and Notable Trends
- Franklin Templeton portfolios lead once again. Franklin India Flexi Cap and Franklin India Fund ranked #1 and #2 respectively, marking the fifth straight quarter in which a Franklin emerging markets strategy has finished in the Top 5.
- At the median, active managers are struggling to add value. The median BA Score declined from 50.6 to 49.3 this quarter, ending the rebound that began in Q2.
- Stock picking has been especially challenging. Concentrated indexes and momentum markets are making it very difficult for long term investors to pick stocks. Over the last 3 years, only 39% of the median manager’s picks have outperformed the benchmark. While their good picks have outperformed by 1.5x as much as their bad picks have underperformed, the net effect is that just 50% of managers added value through stock picking over the last 3 years – that’s down from 56% last quarter.
- Sizing and timing skills have mattered more than ever. The challenging stock picking environment has made sizing and timing decisions that much more important. The good news is that this latest assessment saw a jump in the number of managers adding value through the other decision types. Of note, 65.4% of managers added value through entry timing, and 66.2% added value through size adjusting, when compared with what would have been achieved by chance.
These results are publicly available through Essentia Insight’s Behavioral Alpha Benchmark app, which provides access to all mutual funds, active ETFs, and SMAs in the Benchmark database. With the Insight Pro tier, users can drill down on a portfolio’s Behavioral Alpha Score for deeper visibility into which decision types have been adding and destroying the most value.
How the BA Score is Calculated
The Behavioral Alpha Score (BA Score) is determined using a systematic approach that evaluates investment decision-making skill over a 36-month period. The methodology isolates skill from market conditions by analyzing managers’ hit rates (the percentage of value-added decisions) and payoff ratios (the relative impact of good versus bad decisions).
Each manager’s score is benchmark-adjusted and calculated based on seven key decision types:
- Stock selection – Did the manager choose stocks that outperformed the benchmark over the last 3 years?
- Entry timing – Did the manager add value through the precise timing of their entry?
- Sizing – Did the manager add value through capital allocation decisions, compared to running an equally-weighted portfolio?
- Scaling in – Did the manager add value through the way they scaled into their positions, or would a basic algorithm have done just as well?
- Size adjusting – Did the manager make beneficial mid-position adjustments?
- Scaling out – Did the manager add value through the way they scaled out of their positions, or would a basic algorithm have done just as well?
- Exit timing – Did the manager add value through the precise timing of their exits?
Portfolios with Behavioral Alpha Scores > 50 (which appear to the right of the dotted line) have managers who have been adding value through their overall decision-making over the last three years. Those with scores < 50 (to the left of the line) have been destroying value.
Aggregate trends from our prior rankings (all based on 36-month timeframes):
| Median BA Score | Percent of portfolios adding value |
Percent of portfolios with a hit rate over 50% |
Percent of portfolios with a payoff over 100% |
|
| Ending 2025-Q3 | 49.3 | 48.1% | 21.8% | 56.4% |
| Ending 2025-Q2 | 50.6 | 53.4% | 21.4% | 67.9% |
| Ending 2025-Q1 | 47.8 | 40.2% | 22.1% | 51.6% |
| Ending 2024-Q4 | 48.7 | 43.0% | 31.7% | 55.7% |
| Ending 2024-Q3 | 49.3 | 48.3% | 22.5% | 57.3% |
| Ending 2024-Q2 | 50.3 | 55.7% | 21.6% | 63.6% |
| Ending 2024-Q1 | 51.4 | 56.9% | 25.0% | 65.3% |
| Ending 2023-Q4 | 50.3 | 52.5% | 30.8% | 62.5% |
| Ending 2023-Q3 | 50.6 | 53.3% | 24.4% | 67.8% |
| Ending 2023-Q2 | 50.9 | 56.5% | 28.2% | 71.8% |
| Ending 2023-Q1 | 51.6 | 63.6% | 28.4% | 79.5% |
| Ending 2022-Q4 | NA | 46.7% | 23.3% | 63.3% |
| Ending 2022-Q1 | NA | 43.4% | 18.4% | 68.4% |
About Essentia Analytics
Essentia Analytics is the leading provider of behavioral data analytics services to professional investors and allocators of capital. Led by a team of experts in investment management, technology and behavioral science, Essentia combines next-generation decision attribution analytics technology with human coaching to help both equity fund managers and allocators identify investment skill and bias — and capture performance that was previously being lost to decision-making deficiencies.
To participate in the Benchmark ranking/awards or use the methodology for manager assessment, click here to get started with the Behavioral Alpha Benchmark app.
To contact us, please complete the form below.
