

Reversing a downward trend, active equity manager decision-making added value in the three years ending 30 June 2025.
Our latest Essentia Behavioral Alpha Benchmark ranking shows that active portfolio managers reversed a sustained decline in the value added through their decision-making skill. The median Behavioral Alpha Score for the 135 managers in our ranking – which considers the value added through their decision-making, over the past 36 months, when compared with what would have been achieved by chance – was 50.6, up from 47.8 in the prior period and reversing four consecutive quarters of decline.
Decision hit rates remained soft, with only 21.4% of managers adding value through 50% or more of their decisions. However, decision payoff ratios continued to rise. In a nutshell, the median active equity manager in our ranking demonstrated decision-making skill over the past three years not by getting it right most of the time, but by adding more value through their successful decisions than they gave back through their missteps.
About the Behavioral Alpha Benchmark
The Essentia Behavioral Alpha Benchmark (EBAB) is the industry’s only systematic assessment of investment decision-making skill. Unlike traditional rankings based on past returns, EBAB evaluates how portfolio managers make investment decisions over a 36-month period, isolating skill from luck and market movements.
Using proprietary decision attribution analytics, the ranking assesses managers across seven key decision types. A manager’s Behavioral Alpha Score (BA Score) is calculated based on their hit rate (percentage of decisions that add value) and payoff ratio (the magnitude of good vs. bad decisions). A Behavioral Alpha Score above 50 indicates consistent value-additive decision-making.
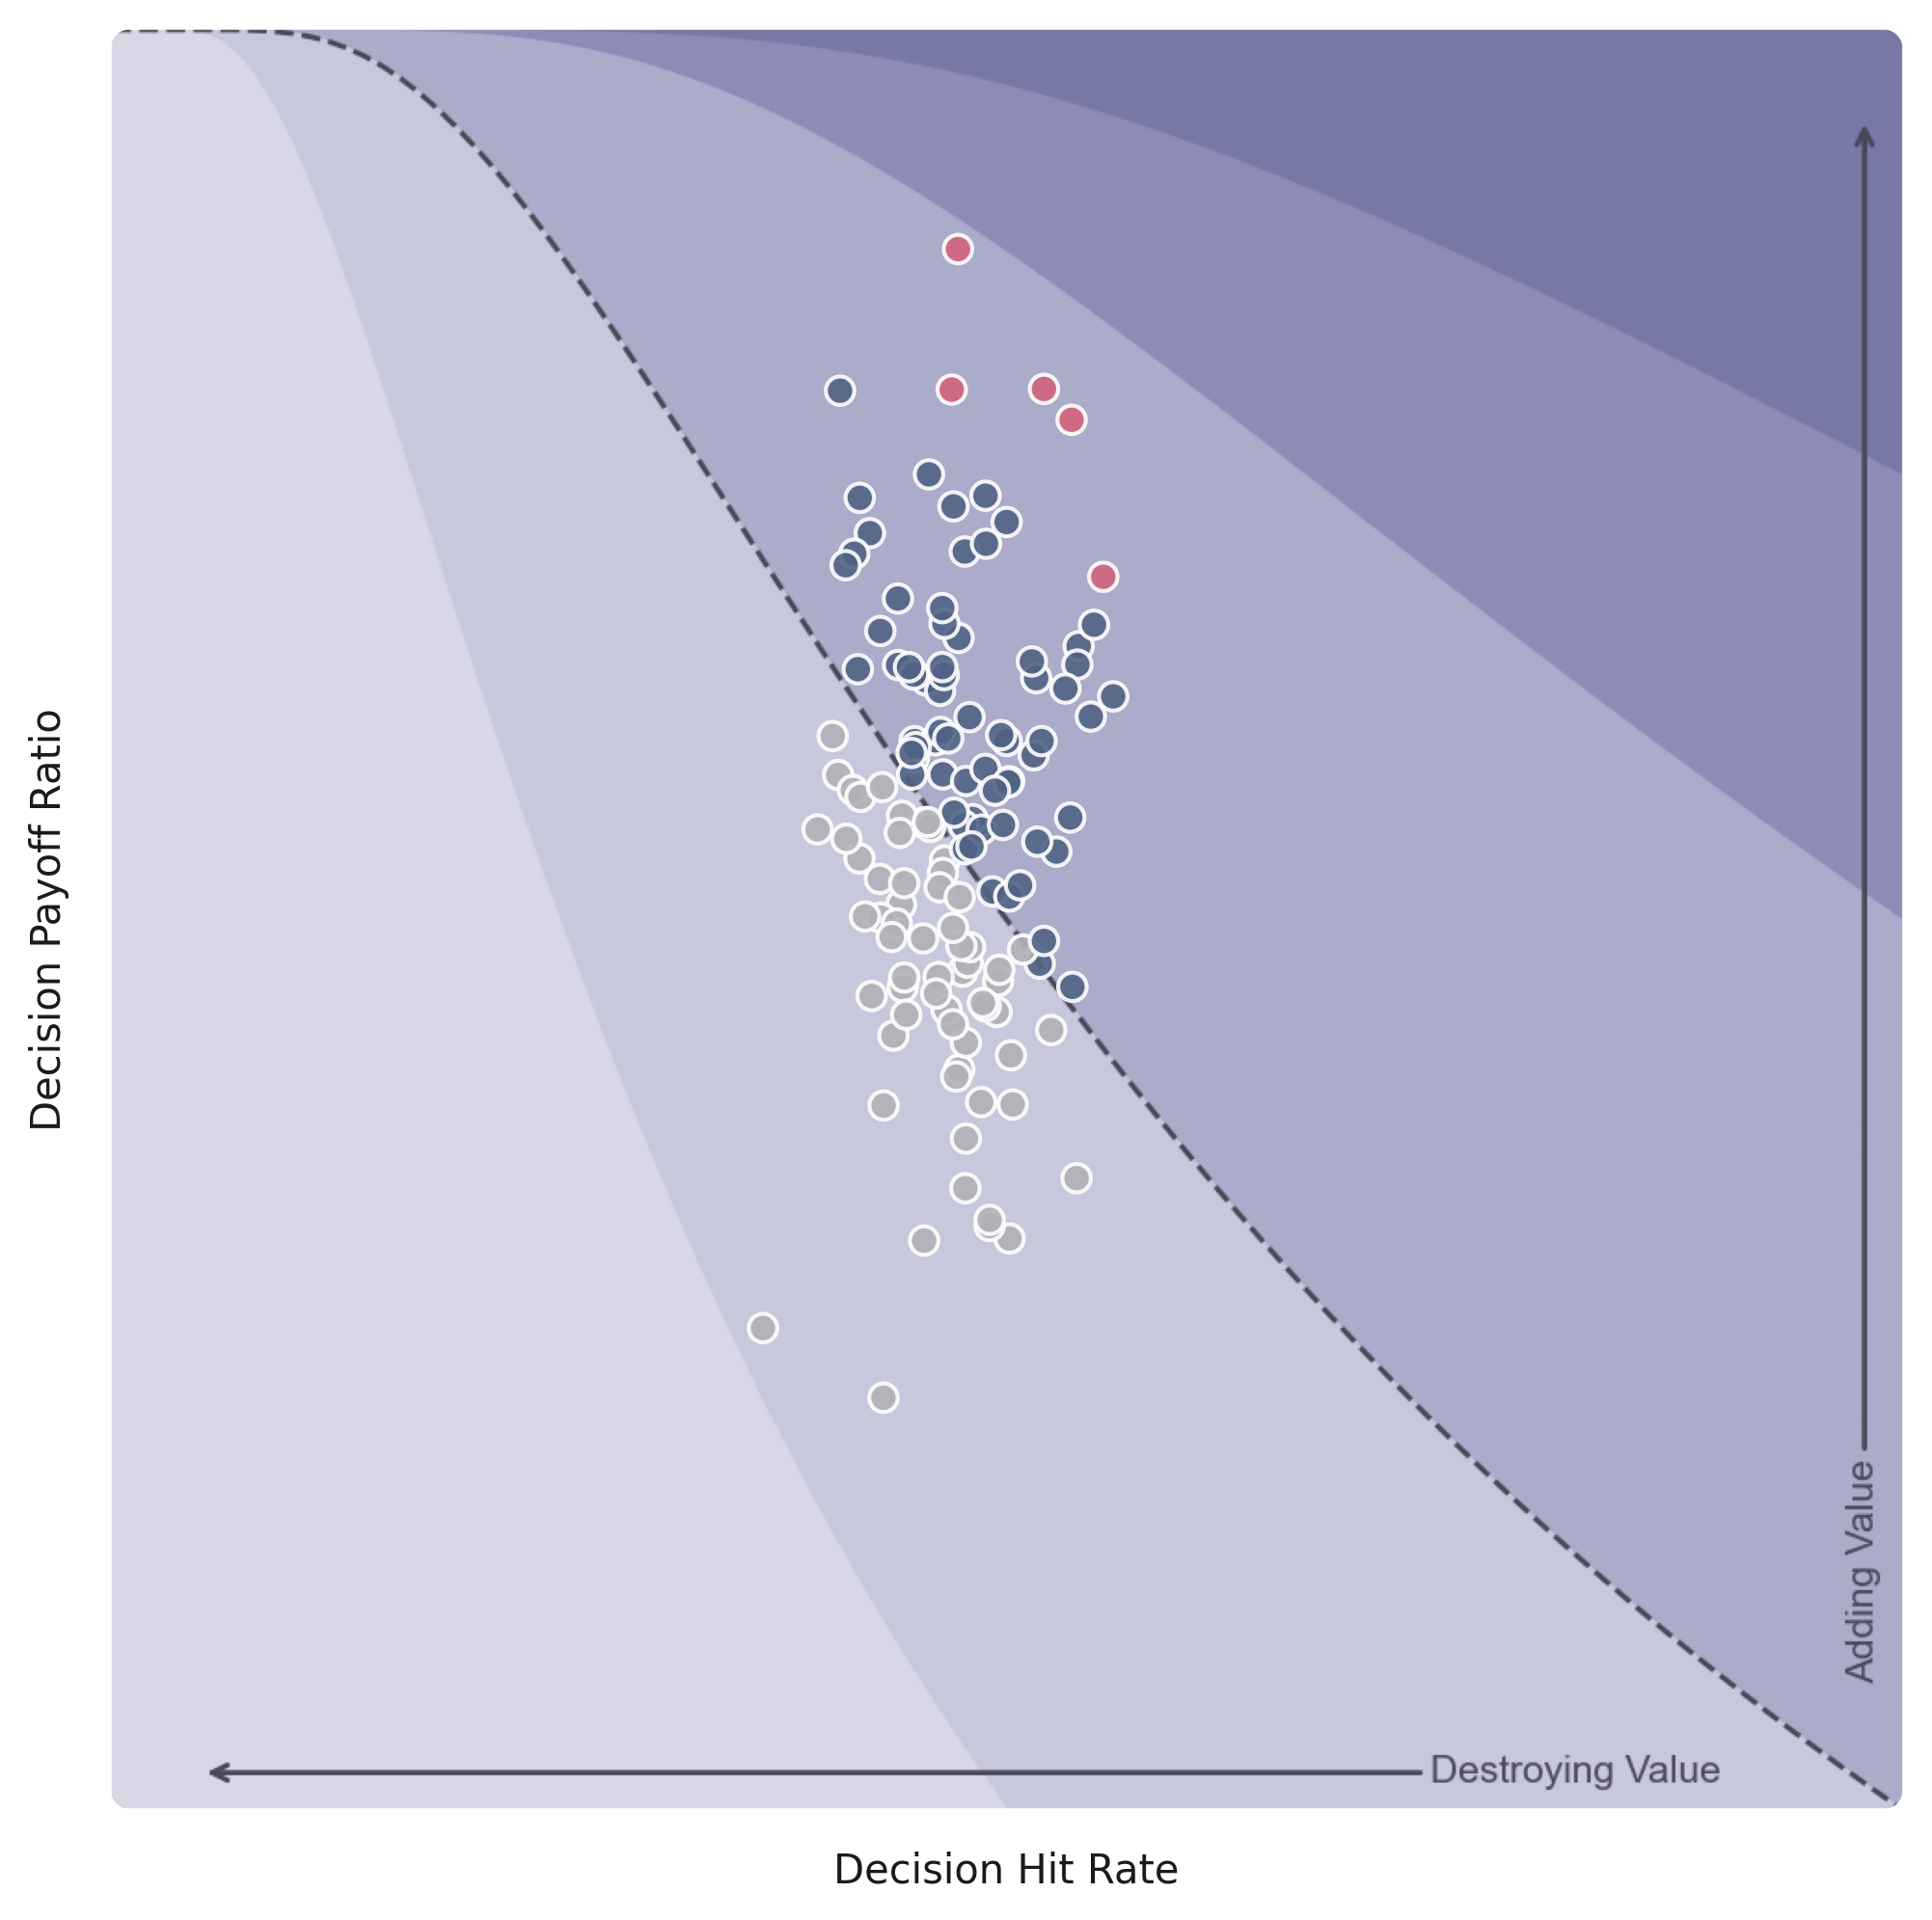
The five highest-scoring managers, represented by the magenta dots, are those towards the upper-right on this frontier diagram — furthest away from 0,0.
The most recent 36-month assessment concluded on June 30, 2025, evaluating the demonstrated decision-making skill of 135 active equity mutual fund and investment trust portfolio managers using the Behavioral Alpha Score.
| Rank | Manager(s) | Portfolio (Benchmark) |
| 1 | Sukumar Rajah |
Franklin India Fund |
| 2 | Salah Shamma | Franklin MENA Fund |
| 3 | Robert Choi Al Chan Chris Richey Kevin Hill Ron Dornau |
Silvercrest International Small Cap Value Fund |
| 3 | Charles Bond Matt Pigott |
Invesco Global Emerging Markets Fund (UK) |
| 4 | Rakesh Bordia Caroline Cai Allison Fisch John P. Goetz |
Pzena International Value Fund |
Key Takeaways and Notable Trends from the Q2 2025 36-month assessment:
- Franklin India assumes the top position with a record BA Score. Having entered our ranking at #5, four quarters ago, Franklin Templeton’s Franklin India fund has steadily ascended, achieving #1 with a BA Score of 73.2, our highest quarterly BA Score on record.
- Our largest field to date. This quarter’s ranking considered 131 actively-managed equity mutual funds and 4 investment trusts.
- A reversal of trend. Last year, we saw the median three-year BA Score fall from 51.4 in Q1 2024 to 47.81 in Q1 2025, illustrating an especially challenging decision-making environment for active managers. That trend has reversed course in the latest period (the three years to 30 June 2025), rising to 50.6 – still shy of its historic highs, but a healthy rebound into value-additive territory.
- Hit rates continued to decline, particularly in stock picking. Only 21.4% of managers had overall decision hit rates above 50%, down slightly from the prior period. Stock picking, in particular, was a challenge in light of index concentration: only 11.5% of managers got their picks right more often than wrong over the last 3 years.
- Payoff increased sharply. Overall payoff ratio – that is, the measure of the value added by a manager’s average winning decision divided by the value destroyed by their average losing decision – increased sharply this quarter, to 116.2% from 102.9%. This was the key driver to improved median BA Score, more than compensating for the decline in hit rates.
These results are publicly available through Essentia Insight’s Behavioral Alpha Benchmark app, which provides access to all mutual funds, active ETFs and SMAs in the Benchmark database. And, with our new Insight Pro tier, you can drill down on a portfolio’s Behavioral Alpha Score for deeper visibility into which decision types have been adding and destroying the most value.
How the BA Score is Calculated
The Behavioral Alpha Score (BA Score) is determined using a systematic approach that evaluates investment decision-making skill over a 36-month period. The methodology isolates skill from market conditions by analyzing managers’ hit rates (the percentage of value-added decisions) and payoff ratios (the relative impact of good versus bad decisions).
Each manager’s score is benchmark-adjusted and calculated based on seven key decision types:
- Stock selection – Did the manager choose stocks that outperformed the benchmark over the last 3 years?
- Entry timing – Did the manager add value through the precise timing of their entry?
- Sizing – Did the manager add value through capital allocation decisions, compared to running an equally-weighted portfolio?
- Scaling in – Did the manager add value through the way they scaled into their positions, or would a basic algorithm have done just as well?
- Size adjusting – Did the manager make beneficial mid-position adjustments?
- Scaling out – Did the manager add value through the way they scaled out of their positions, or would a basic algorithm have done just as well?
- Exit timing – Did the manager add value through the precise timing of their exits?
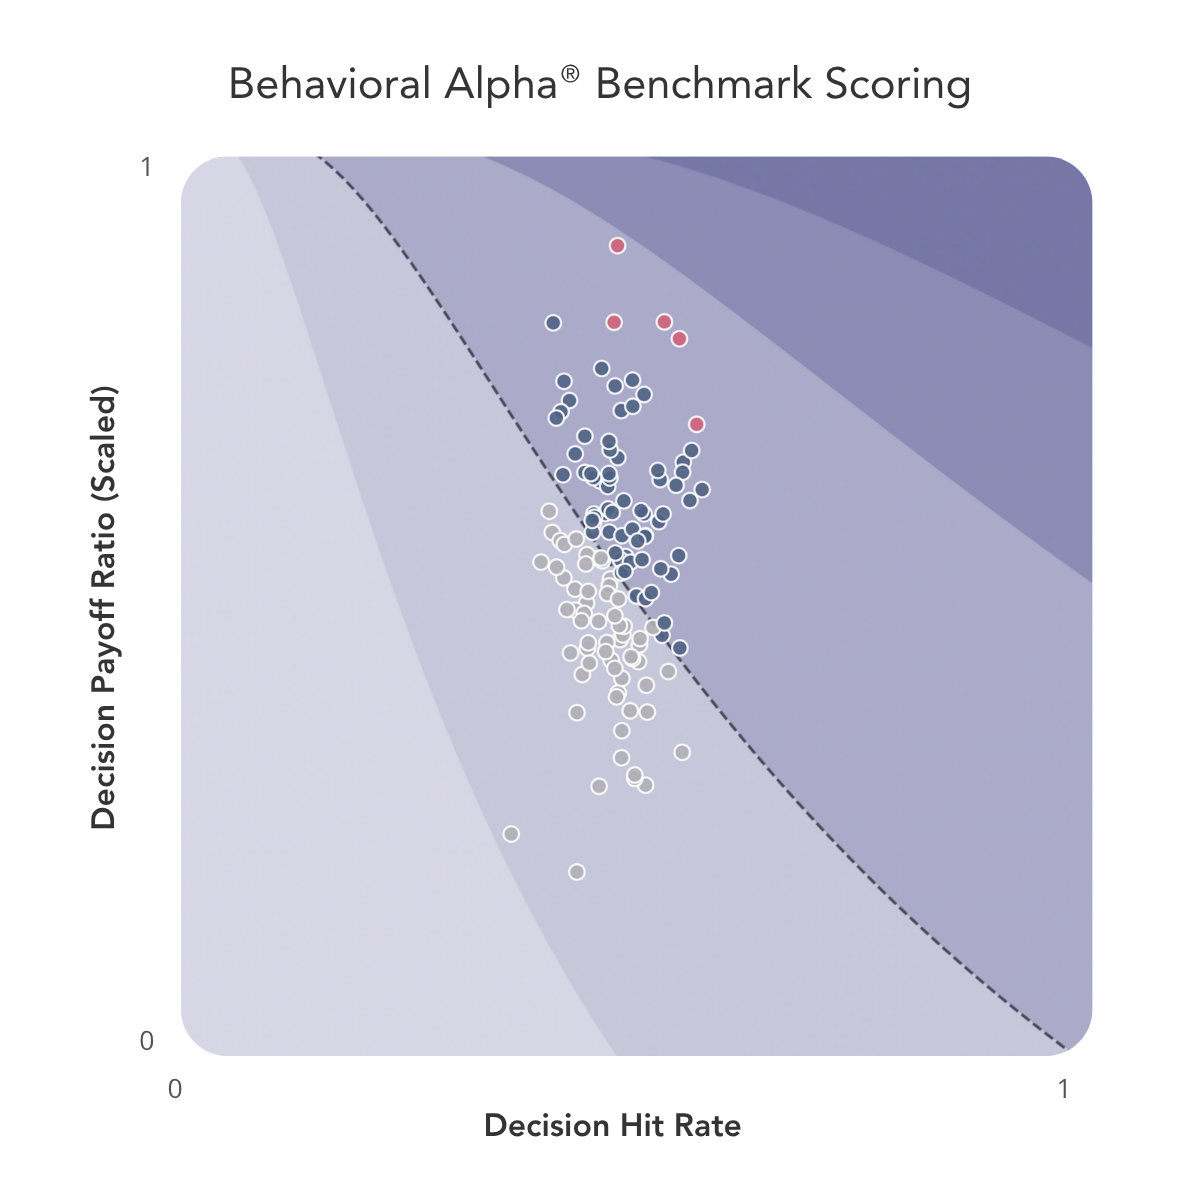
Portfolios with Behavioral Alpha Scores > 50 (which appear to the right of the dotted line) have managers who have been adding value through their overall decision-making over the last three years. Those with scores < 50 (to the left of the line) have been destroying value.
Aggregate trends from our prior rankings (all based on 36-month timeframes):
| Median BA Score | Percent of portfolios adding value |
Percent of portfolios with a hit rate over 50% |
Percent of portfolios with a payoff over 100% |
|
| Ending 2025-Q2 | 50.6 | 53.4% | 21.4% | 67.9% |
| Ending 2025-Q1 | 47.8 | 40.2% | 22.1% | 51.6% |
| Ending 2024-Q4 | 48.7 | 43.0% | 31.7% | 55.7% |
| Ending 2024-Q3 | 49.3 | 48.3% | 22.5% | 57.3% |
| Ending 2024-Q2 | 50.3 | 55.7% | 21.6% | 63.6% |
| Ending 2024-Q1 | 51.4 | 56.9% | 25.0% | 65.3% |
| Ending 2023-Q4 | 50.3 | 52.5% | 30.8% | 62.5% |
| Ending 2023-Q3 | 50.6 | 53.3% | 24.4% | 67.8% |
| Ending 2023-Q2 | 50.9 | 56.5% | 28.2% | 71.8% |
| Ending 2023-Q1 | 51.6 | 63.6% | 28.4% | 79.5% |
| Ending 2022-Q4 | NA | 46.7% | 23.3% | 63.3% |
| Ending 2022-Q1 | NA | 43.4% | 18.4% | 68.4% |
About Essentia Analytics
Essentia Analytics is the leading provider of behavioral data analytics services to professional investors and allocators of capital. Led by a team of experts in investment management, technology and behavioral science, Essentia combines next-generation decision attribution analytics technology with human coaching to help both equity fund managers and allocators identify investment skill and bias — and capture performance that was previously being lost to decision-making deficiencies.
To participate in the Benchmark ranking/awards or use the methodology for manager assessment, click here to get started with the Behavioral Alpha Benchmark app.
To contact us, please complete the form below.
